It’s been a while since I’ve last blogged but I wanted to give an update on some of the new work I’ve been doing. All characters are mostly in the game now, which puts the total up to 8 characters upon release. I may add more characters but at the moment, I feel that I have a good cast of dynamic game play. Why would anyone want to use Machine Learning? Machine Learning essentially speeds up the iterative cycle of development and can identify balance issues within the game. I’m using Google Analytics for my machine learning and it’s pretty simple to get up and running. Since, I am using the Unreal Engine, I decided to use Google Analytics Provider.

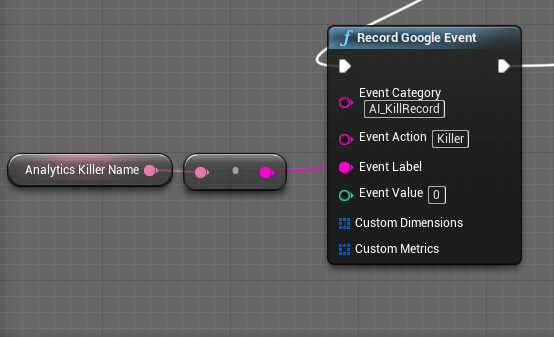
I’ve been using Google Analytics Provider for some time now and it works really well. I’m sure a person can use something native in Unreal Engine, but this was the quickest path to getting my analytics working in no time. Within my blueprints during the section where deaths are registered, I add a function call using the ‘Record Google Event’ function call, which I’ve included below. Notice that I logged the Killer name as the label, which is really just the name of the character.
Next, I setup my dedicated server to play the game with bots enabled and then I just let the game run while I collect my data. As the bots fight each other, the ‘Record Google Event’ AI_KillRecord is called with the Killer’s name. You may want to also add a victim event to gather even more information. Once the data is collected, Google waits a day before it’s posted to the analytics site and you’ll see something like the following below.

Here’s where the magic happens. Notice that I have an event named ‘AI_KillRecord’. When we click on it, I get.
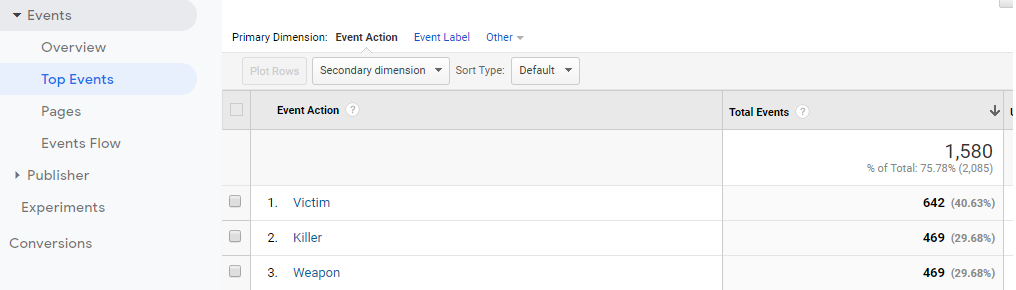
These are the ‘event actions’, which is the detail behind the AI_KIllRecord Event. So, now if we want to understand which characters are overpowered, we would click the Killer link and get the next screen where the data is.
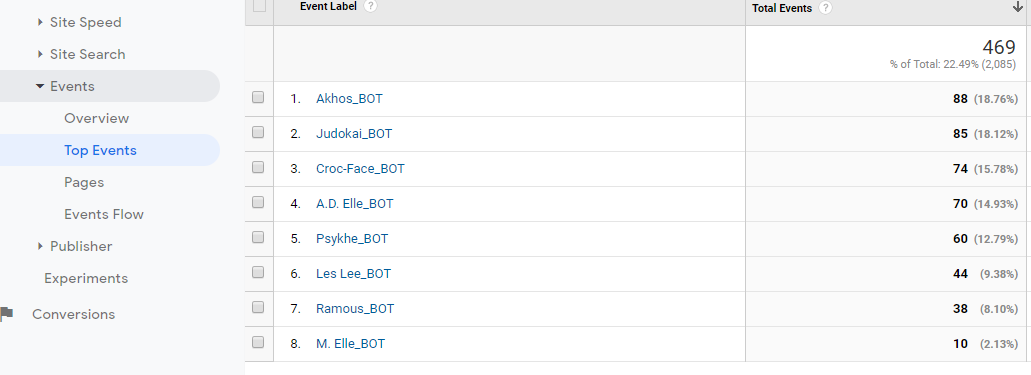
So, here are the bots. Since there are 8 characters, you would a mean (average) for each character would be about 12.5% of the kills with some variability distributed around the mean. So, if we think of the above data in the shape of a bell curve, Psyche would very close to the mean. We would expect this bell shaped curve to be high and tight around the mean. In other words, we would expect all the characters to be anywhere around 10% to 15% if we included variability. However, you’ll notice some outliers to this range of numbers. Specifically, there are two which are way above the 15% number. These characters are over-powered because they get more kills than the other bots. Next, you’ll notice there are who characters which are really below the 10% number. These characters are under-powered because they get less kills than the other bots. What I’ll need to do is adjust the attack speed or damage to bring the kills closer to the 12.5% number.
I believe above demonstrates a sound method for machine-learning using the Unreal Engine, Google Analytics Provider plugin and basic statistics to understand how the basic combat statistics of the characters. If there is a need, one could take this a step further by understanding specific combat information.